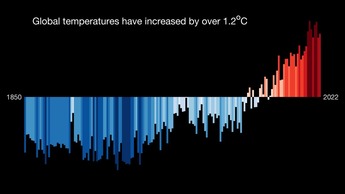
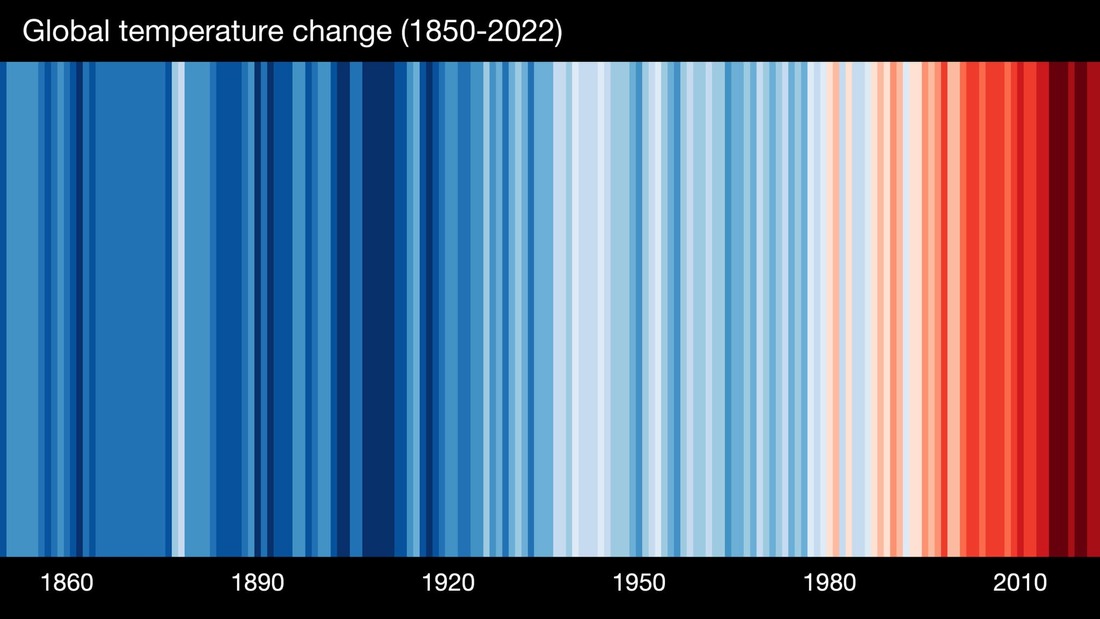
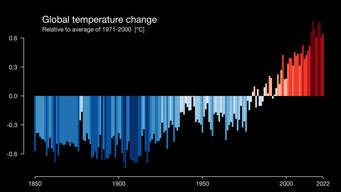
 | Today is #showyourstripes day, so let's take a moment to see how temperatures on Earth have been doing and talk about climate change. Here are figures of global average surface temperatures from 1850-2022, where each stripe/bar represents the average temperature over a year based on records all over the world. The red colors show the rise in average temperature in recent years. I decided to share this in stripes, bars and bars with numbers and axes so you can pick the one that feels most accessible for you. You can go to showyourstripes.info to find stripes for different countries, regions and cities, and virtually everywhere you will see the stripes turn from mainly blue to mainly red. |
Climate change is effecting every inhabited part of the planet. And climate action movements are happening across the world too. A difference can be made in so many ways and scales, and we are making progress, but much more, sustained, and faster action is needed than we are doing now.
If you’re not sure what you can do or how to start to this process, here are some suggestions. Your action for today or this week could be to set aside some time to start to work that out. You could have a conversation about climate change with friend or journal about it or read/watch/listen, learn and reflect about it. You could search for a local event or a community effort and show up to it. You could start knitting a climate stripes scarf (and then wear it or send it to me to wear). You could ask for help and support from your network or a professional if this feels overwhelming to you. You could take a moment to take in that we live all together on one planet for the rest of our lives and we are one part, in one moment in time, of an Earth system with a long history, not the center of it and not separate from it. And then, once you do a thing, make a plan to do it again soon. One day, one thing, one step at a time.
If you are a McGill student, you could apply to be a TA (graduate students) or take our new campus-wide course FSCI198 Climate Crisis and Climate Actions, an interdisciplinary, whole-person introduction to the climate crisis and individual and collective actions to address it. I will be joining an inspiring, interdisciplinary team to teach it this fall. See here for more information and the trailer for the course: https://www.mcgill.ca/ose/courses/fsci-198
Check out showyourstripes.info for more details on the figures I am sharing - they were first developed by Ed Hawkings.
Also check out biodiversitystripes.info for similar figures illustrating biodiversity loss over time.
Natalya


 RSS Feed